Observability
Metrics, logs and alerts. Live.
Server metrics refresh every two seconds while you watch, logs from every server and app are searchable in one place, and alerts reach email, Slack, Discord, Telegram or Microsoft Teams. Uptime checks, deploy markers and incident timelines sit alongside.
Live metrics
CPU per core, load, memory, disk, inodes and network, with history from one hour to 90 days and deploy markers on every chart.
Central logs
System, proxy, app and deploy logs in one search. Secrets are masked before anything is stored.
Alerts where you work
Thresholds on any metric with duration and recovery conditions, sent to the channels your team already uses.
Uptime from outside
HTTP, keyword, TCP and ping checks from several regions, plus SSL and domain expiry warnings.
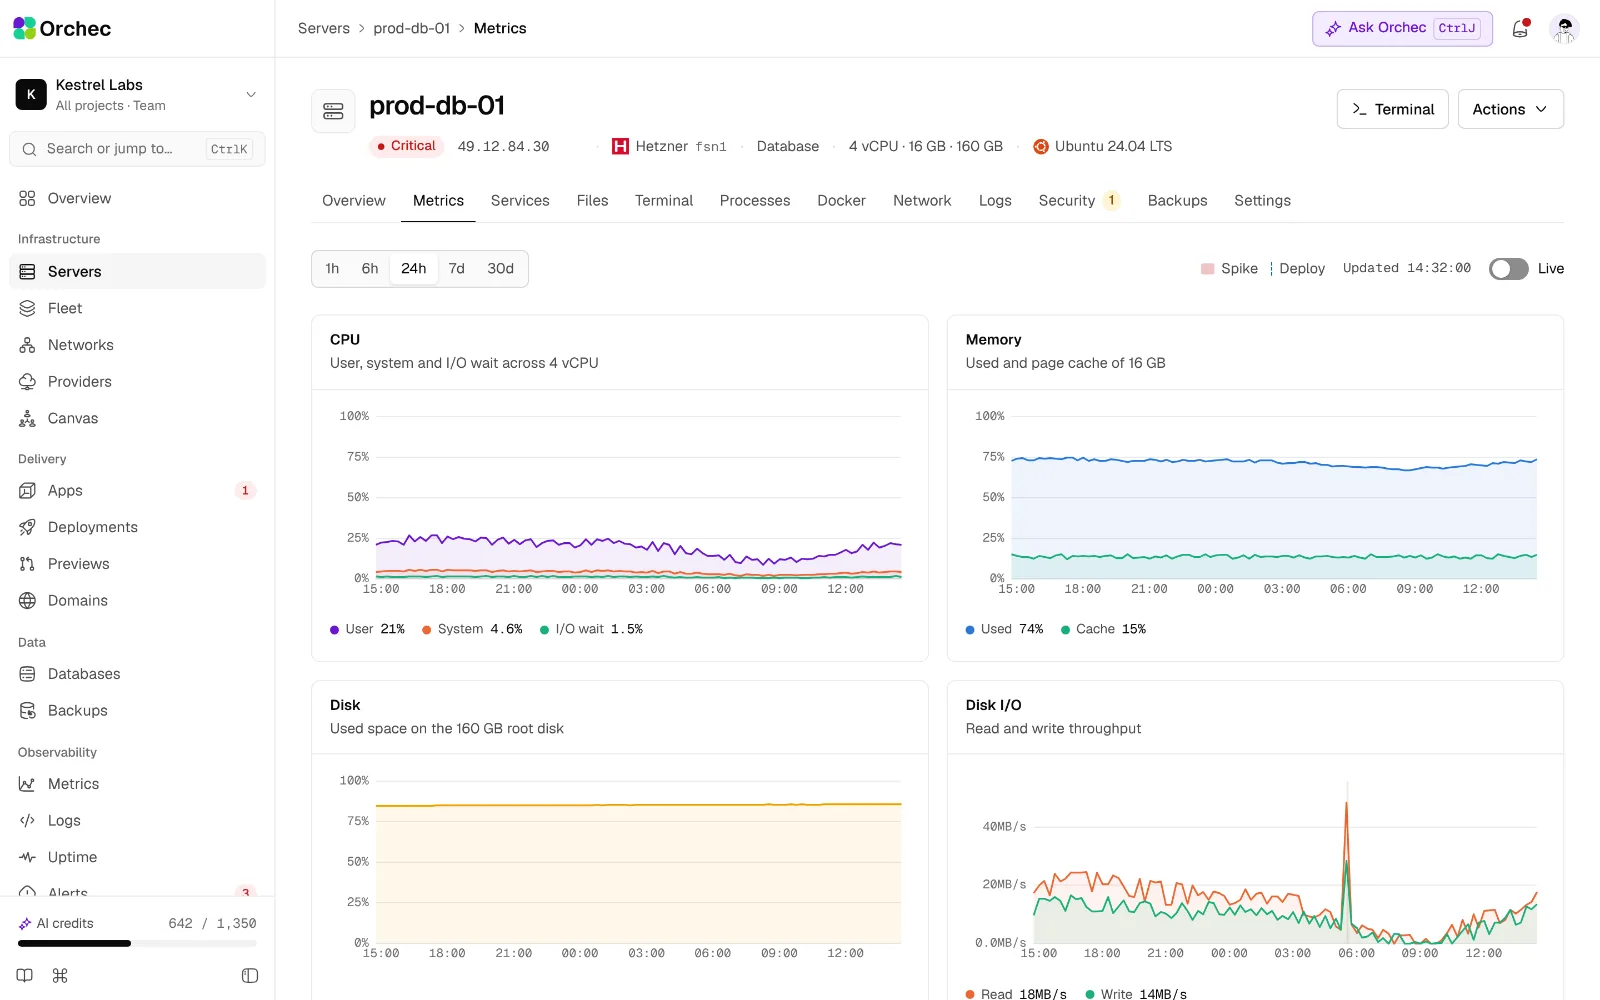
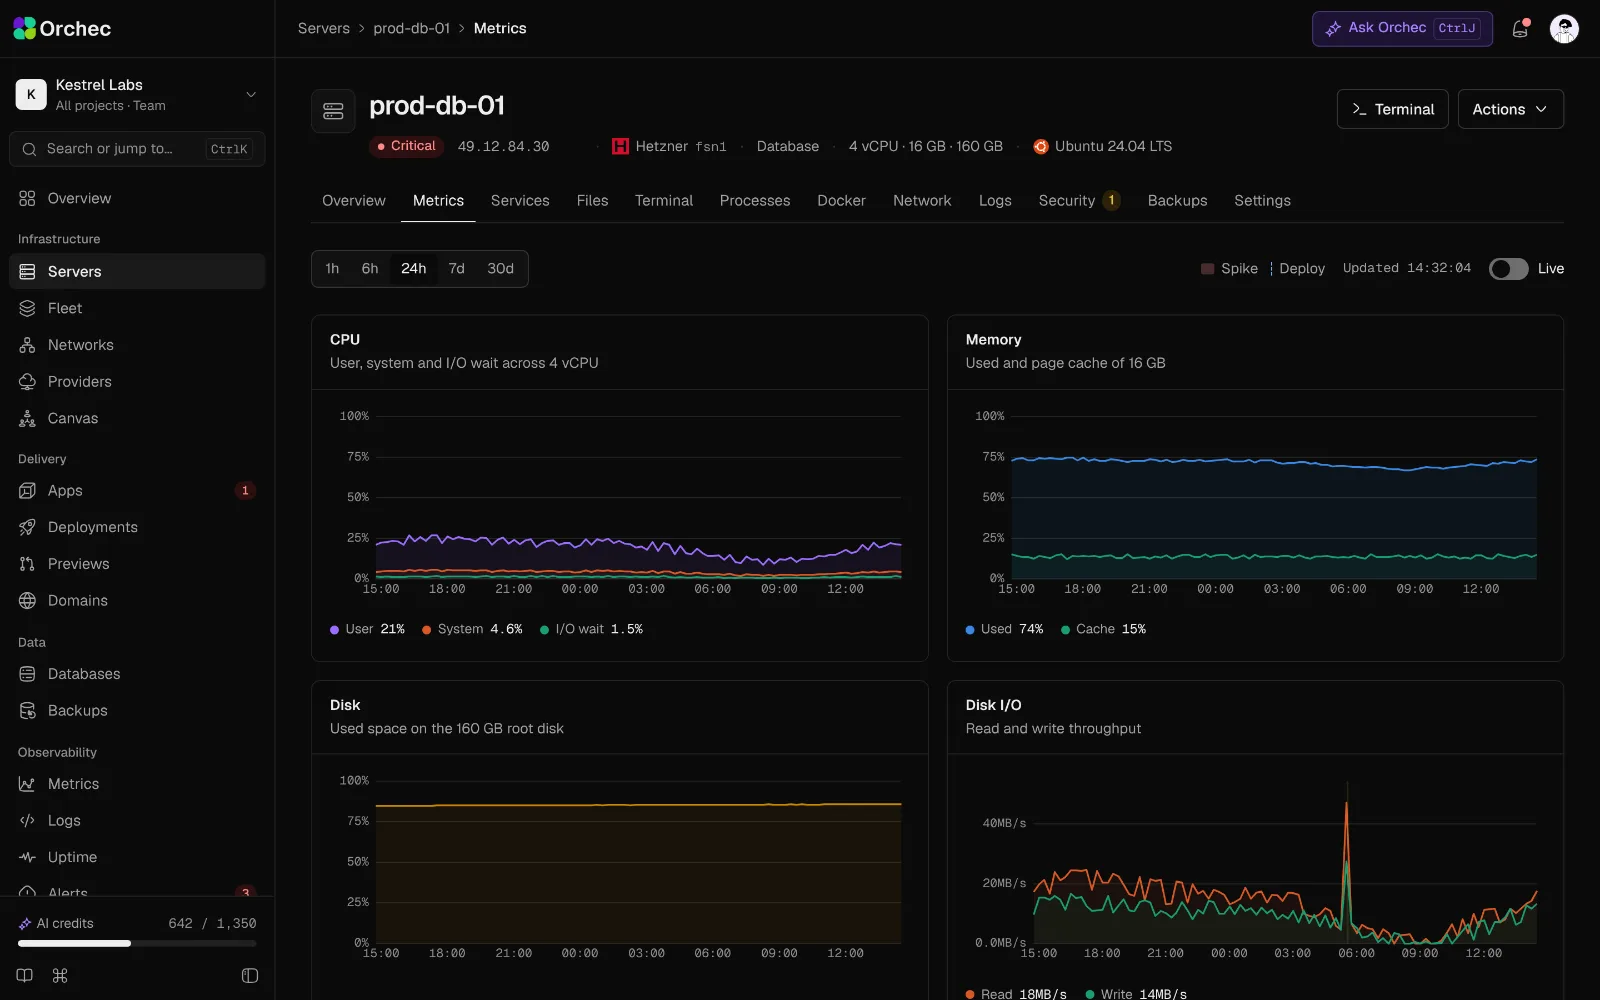
Live CPU, memory, disk and network for one server, with deploy markers.
Metrics
Servers, containers, apps and capacity.
Server metrics
CPU, per-core, load, RAM, swap, disk, inodes and network.
Historical charts
1 hour to 90 days, with period comparison.
Server insights
Recommendations from historical usage.
Disk I/O and out-of-memory events
I/O wait, latency, OOM kills and reboot history.
Container metrics
CPU, memory and restarts per container.
App metrics from proxy logs
Requests per second, p50/p95/p99 latency, and 4xx and 5xx rates.
Live mode
Charts refresh every 1–2 seconds while you watch, for CPU, RAM, disk I/O and network.
Per-process usage history
Top processes by CPU and RAM saved every minute, so you can see what caused a past spike.
On the roadmap · 8 more
- Custom metricsPrometheus scrape and OpenTelemetry ingest from your apps.
- Capacity forecast"Disk full in 9 days at current growth."
- AI anomaly detection AILearns normal patterns per server and app and flags unusual CPU, traffic or error rates.
- AI chart explainer AIClick any spike and ask why; AI lines up deploys, cron runs, traffic and logs at that moment.
- AI rightsizing AIRecommends a smaller or larger server from 30 days of usage, with the monthly cost change.
- Spike log AIEvery spike recorded with start, peak, duration and likely cause, searchable later.
- Per-site and per-app usageCPU, RAM, bandwidth and requests broken down by site or app, not just by server.
- Traffic spike and DDoS detectionDetects request surges by IP or route and offers a one-click rate limit or block.
Logs
Tail, search and keep what matters.
Live log tail
Stream logs for a site or service in the browser.
Central log search
System, proxy, app and deploy logs, filtered by server, app, level and time.
Secret redaction
Tokens, keys and passwords masked before storage.
AI log search in plain English
AI"500 errors on checkout since yesterday's deploy" becomes a query with results.
On the roadmap · 5 more
- Structured log parsingJSON logs split into searchable fields.
- Retention and exportRetention per project and export to S3.
- Log-pattern alertsAlert when a phrase appears N times in M minutes.
- AI log summarizer AIGroups thousands of lines into a few patterns with counts and first and last seen.
- AI root-cause hints AILinks an error burst to its likely cause across logs, metrics and recent changes.
Alerts, uptime and incidents
Know first, and know why.
Alert rules
Thresholds on any metric, with duration and recovery conditions.
Alerts and incidents
Notification channels
Email, Slack, Discord, Telegram, Microsoft Teams and webhooks.
Alerts and incidents
Uptime checks
HTTP, keyword, TCP and ping from several regions.
Uptime and status pages
SSL and domain expiry
Alerts 30, 14 and 7 days ahead.
Uptime and status pages
Response time history
Per monitor and region.
Uptime and status pages
Heartbeat monitors
Alerts when a cron job or backup stops checking in.
Uptime and status pages
On the roadmap · 11 more
- Grouping, snooze and maintenance windowsFewer duplicate alerts during known work.
- PagerDuty, Opsgenie, SMS and pushPaging for critical alerts.
- Incident timelineAlerts, deploys, config changes and actions in one view.
- Command centerWhat is unhealthy now, what changed and which actions are safe.
- On-call and escalationRotations and escalation steps.
- AI alert triage AIEach alert arrives with a short likely-cause summary and a suggested first step.
- AI noise reduction AIFinds flapping or duplicate alerts and proposes better thresholds.
- AI postmortem writer AIDrafts a blameless postmortem from the incident timeline.
- Public status pagesCustom domain and subscriber notifications.
- Incident updatesPost updates to the status page and subscribers.
- AI incident updates AIDrafts status-page updates in plain language from the incident timeline for a person to post.
Errors and tracing
From an exception to the release that caused it.
On the roadmap · 4 more
- Error trackingGroups exceptions with stack traces and links each to the release that introduced it.
- Slow endpoint listEndpoints ranked by p95 latency.
- Distributed tracingOpenTelemetry traces across API, database and workers.
- AI error explainer AIExplains a stack trace, points to the file and line in the repo and proposes a patch as a pull request.
Cost
What your infrastructure costs, and where to save.
Price before you create
Monthly price shown for every server, volume and snapshot before creation.
On the roadmap · 6 more
- Cost dashboardReal provider bills plus estimates, per server, app and project.
- Budgets and alertsMonthly budgets per project with alerts at 80% and 100%.
- Idle resource finderUnused servers, volumes, snapshots and IPs.
- Cost per clientTotals per client for agencies, ready to invoice.
- AI cost optimizer AIProposes concrete savings (resize, consolidate, switch provider) with the monthly amount saved.
- AI cost forecast AINext month's bill projected from the current trend.
Be first in when Orchec opens.
Join the waitlist for an early invite, or book a demo and we’ll walk your team through it on your own stack.